Statistics & data
Turn your numbers into daily decisions
Revenue, average ticket, occupancy, cancellations, no-shows, new clients, booking sources and team performance: everything is already structured in Bookelya.
Choose a period, read your indicators in seconds and spot where to act without exporting a single spreadsheet.
No credit card • No commitment • Instant start

10+
Indicators tracked at a glance
5
Available analysis periods
3
Compared booking sources
2
Detailed rankings to open
A summary view that gets straight to the point
Revenue, completed appointments and average ticket appear immediately to position the selected period.
A clear reading of your team
You quickly identify the busiest team members, their revenue and occupancy level.
Services to compare effortlessly
Service ranking helps you spot what really sells, what fills the schedule and what deserves adjustment.
Quick read
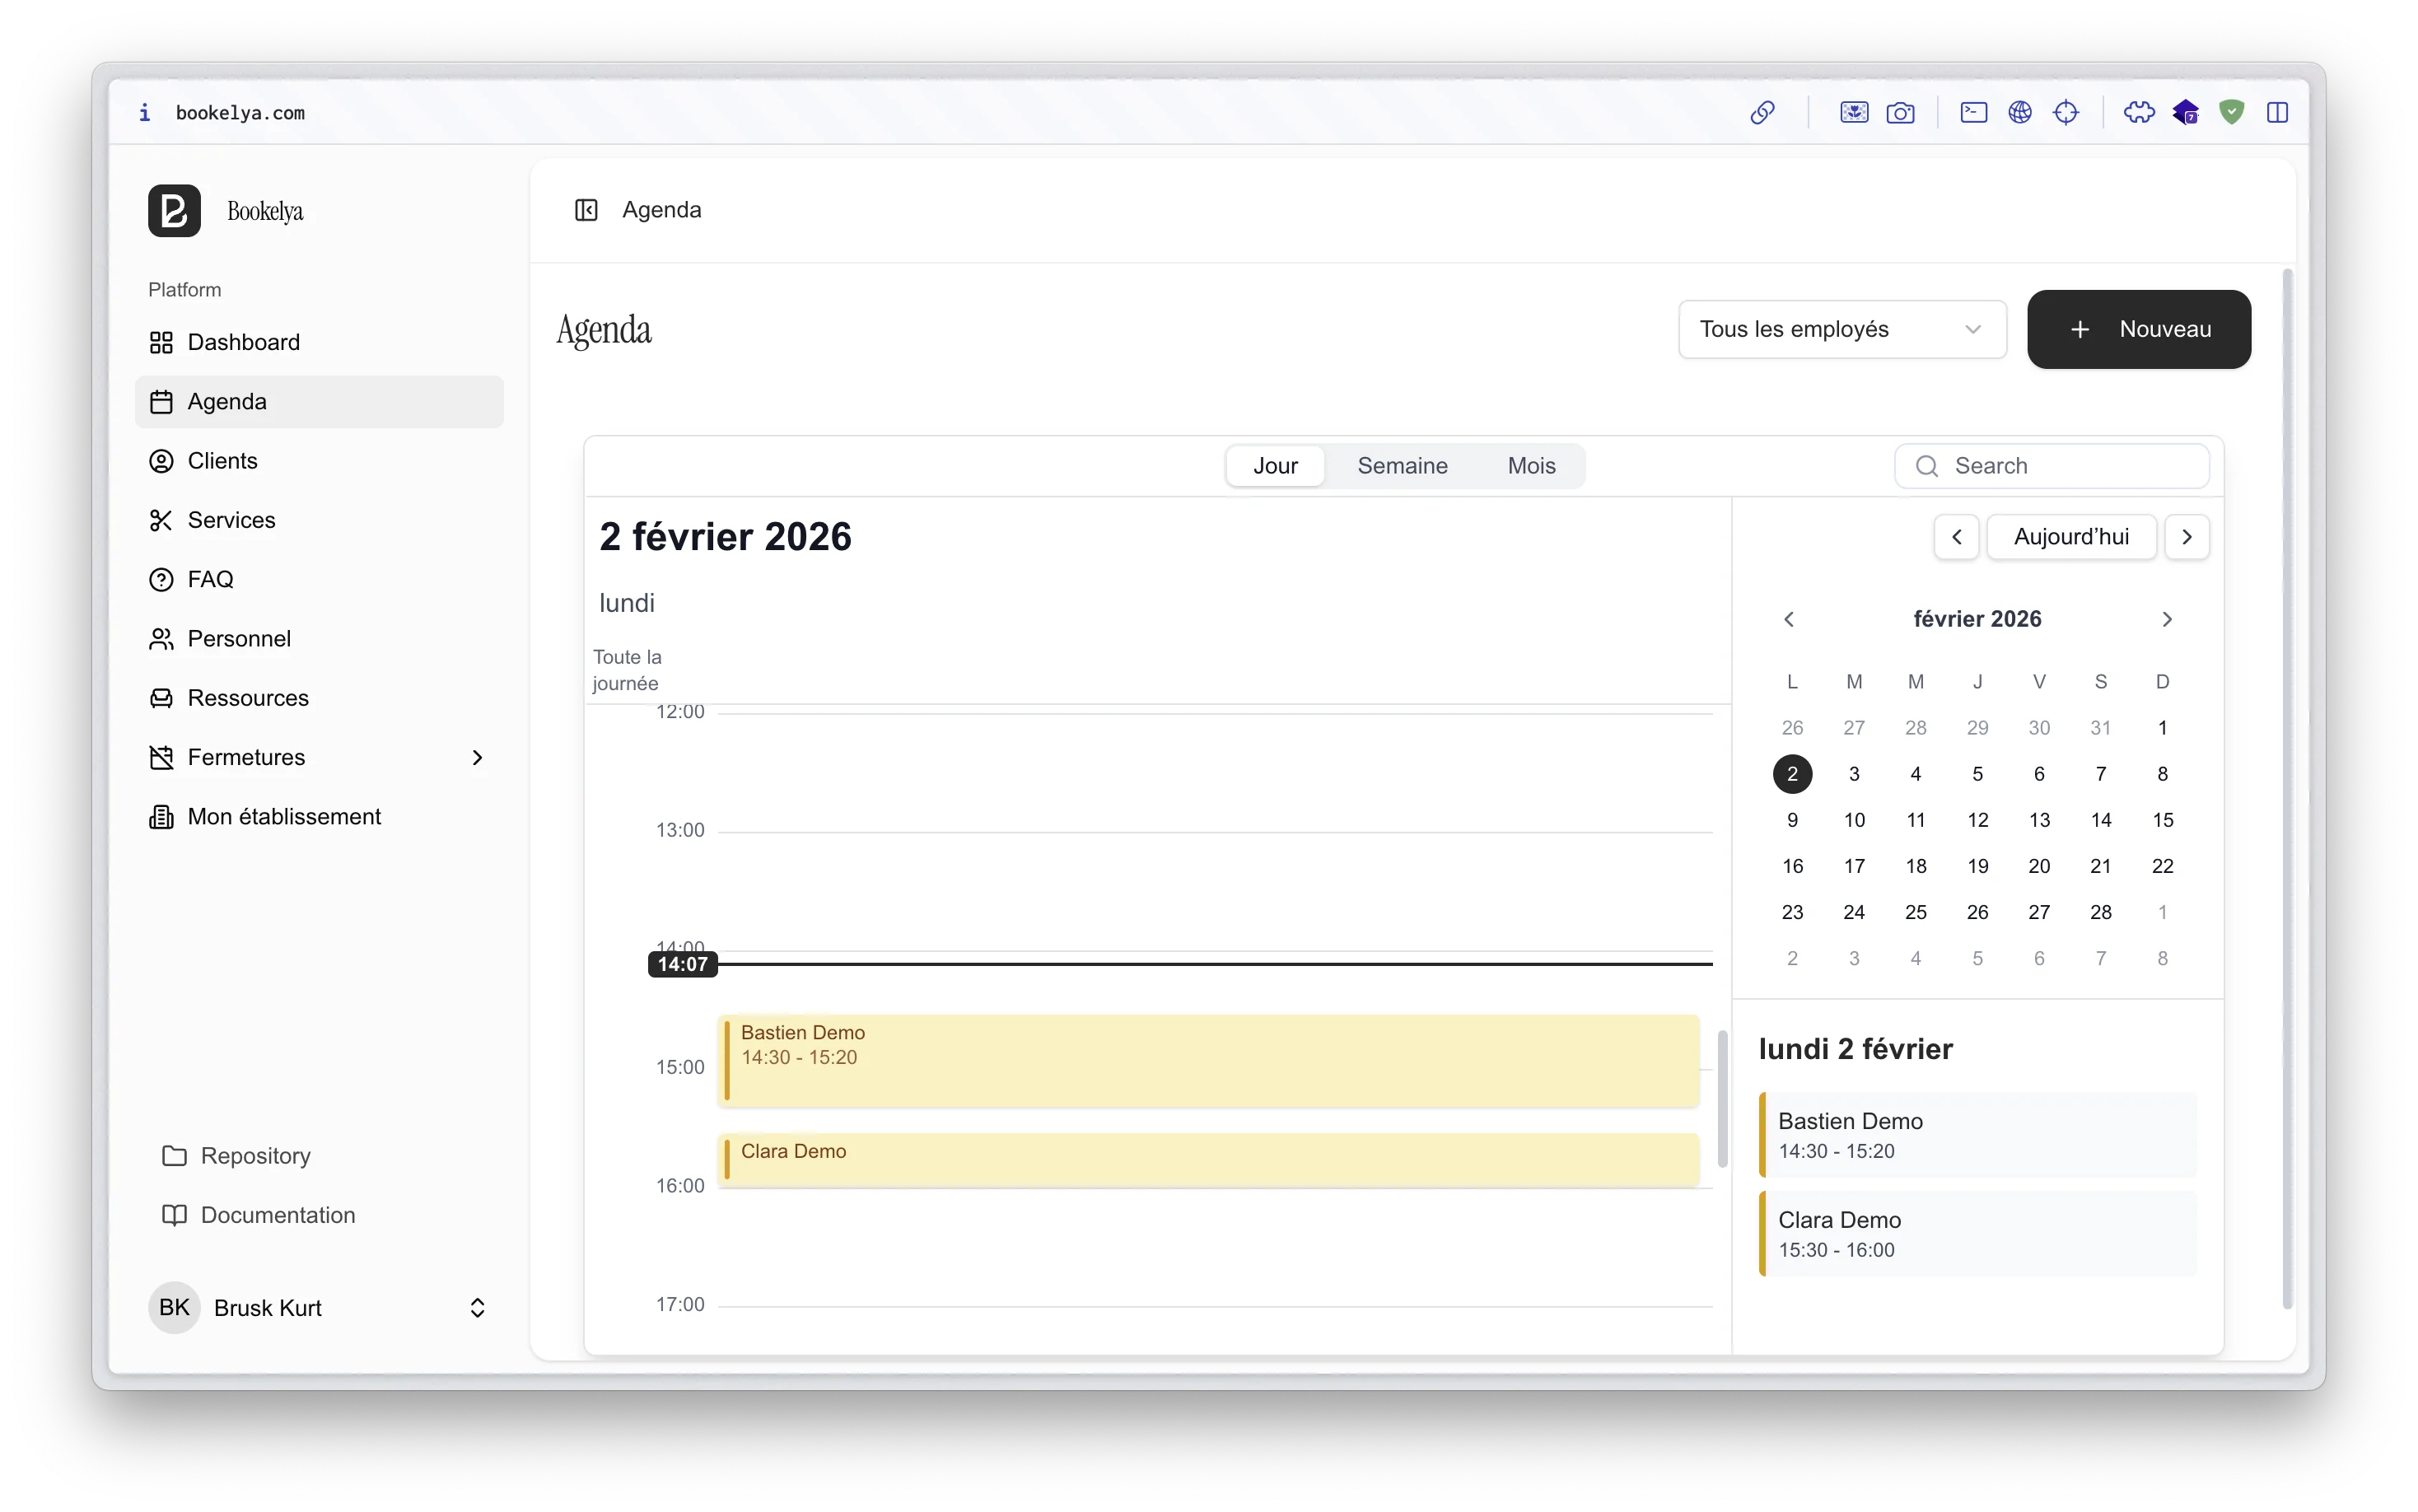
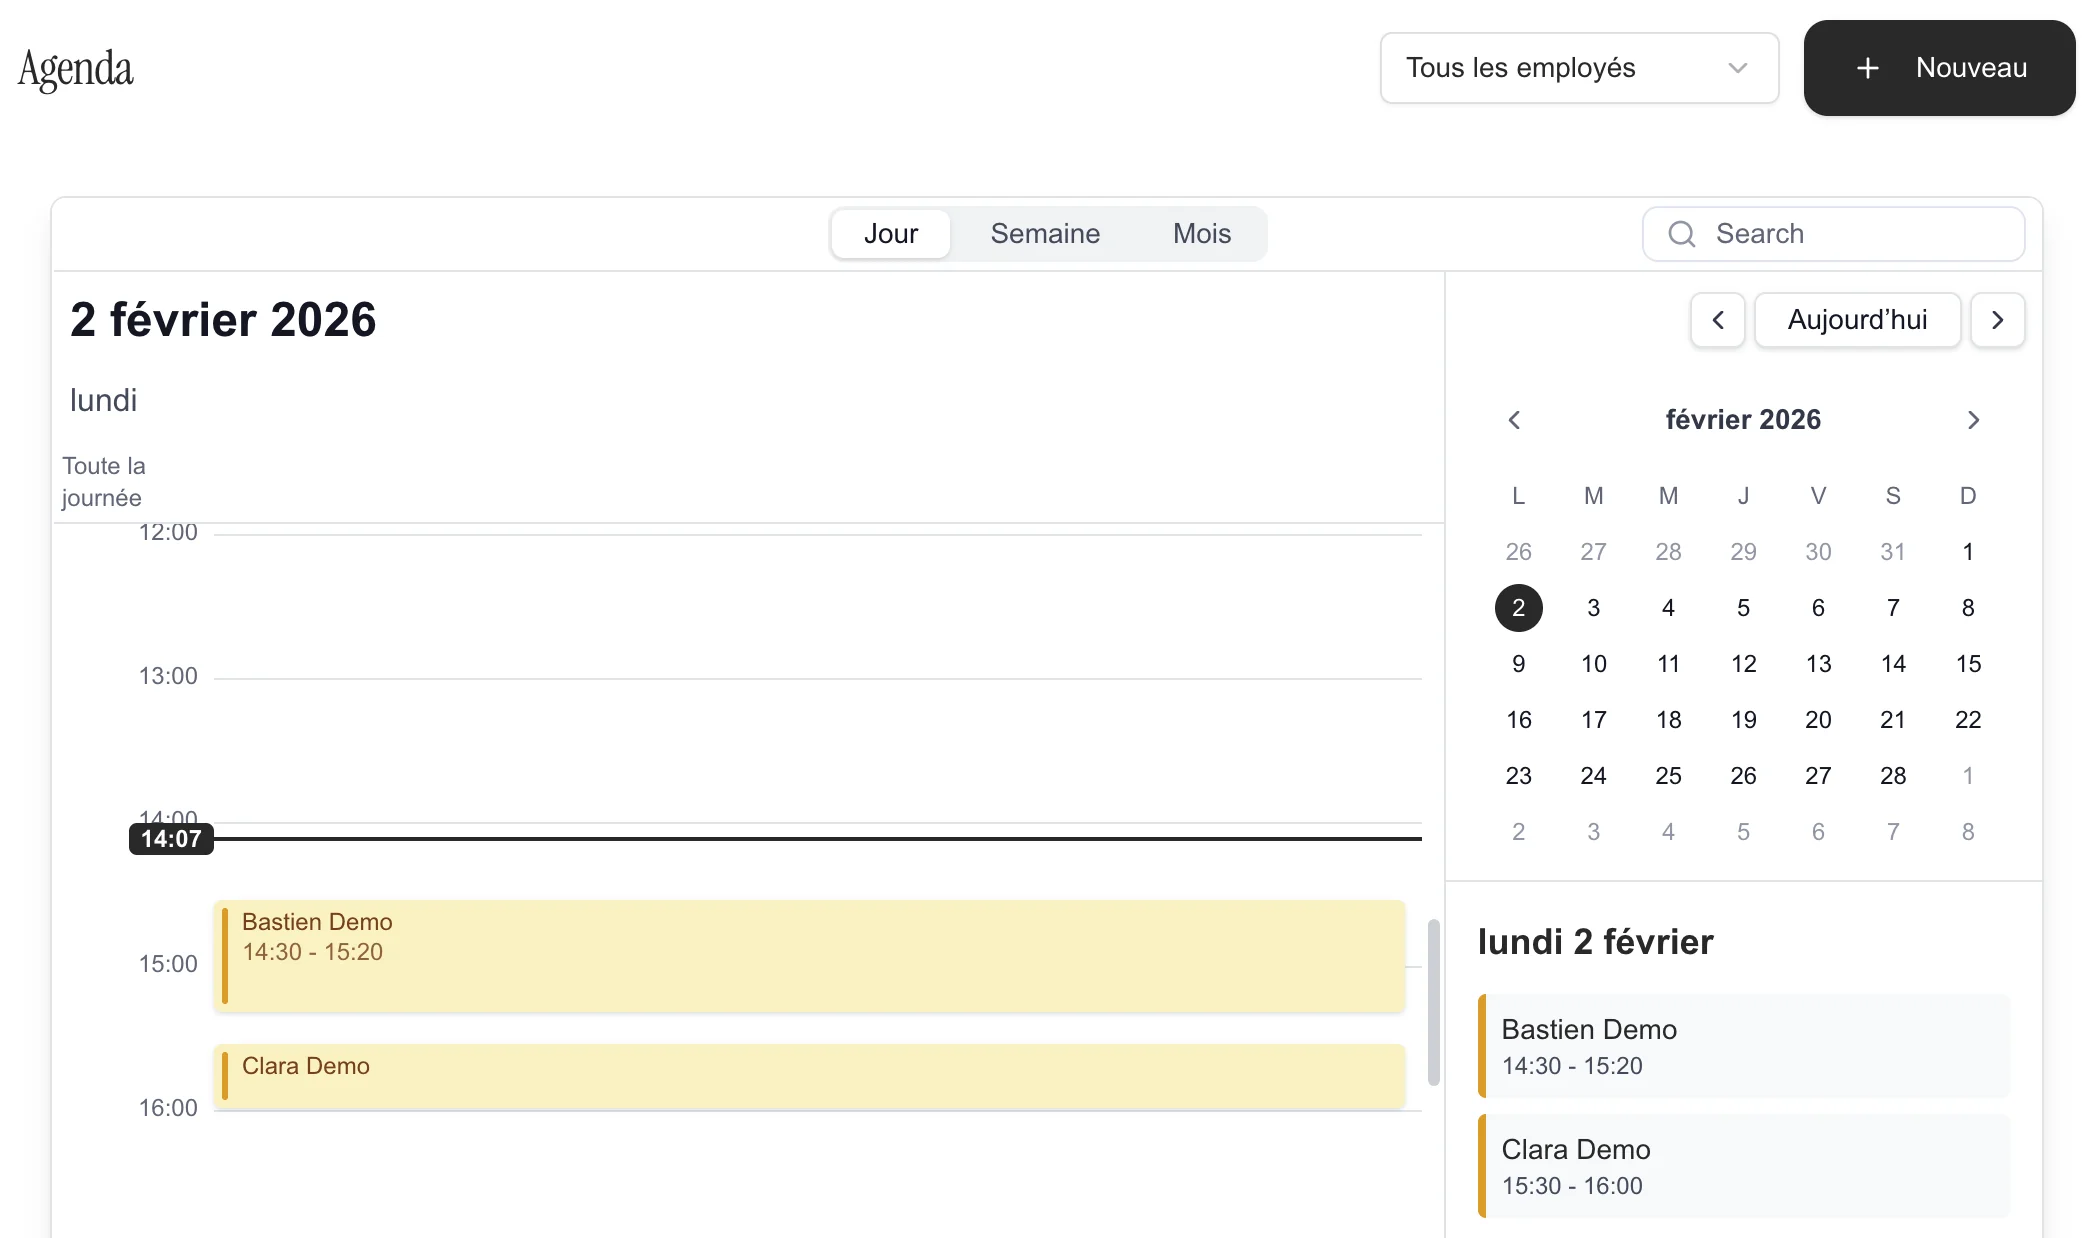
Move from the selected period to a clear reading of your business
In a few clicks, you get a summary view and then the details by client, source, team member and service.
Choose your period
Move from the last 7 days to the quarter, or analyze a custom date range.
Read your KPIs in seconds
Revenue, completed appointments, average ticket, occupancy, cancellations and absences are visible immediately.
Open the useful details
Refine by booking source, new clients, team and services to see where to act.
Immediate benefits
What you understand from the very first visit
Spot your real trends
You immediately see whether activity is growing, stalling or concentrating on specific days.
Understand what actually fills the schedule
The source of appointments and the share of new clients become readable at a glance.
Decide faster
You spend less time rebuilding numbers and more time fixing what slows the business down.
Problems and solutions
What this feature solves in practice
You are still managing by feel
Before
Without a consolidated view, it is hard to know whether the change comes from volume, average ticket or more cancellations.
With Bookelya
The main KPIs immediately show revenue, completed appointments and the daily average.
Variations remain invisible
Before
The calendar alone does not clearly show strong days, recurring slow periods or moments when business accelerates.
With Bookelya
Day-by-day trends reveal your performance over 7 days, 30 days, the month, the quarter or your custom dates.
The source of appointments remains unclear

Before
When requests come from several channels, it becomes hard to know what really fills the schedule.
With Bookelya
The source breakdown separates online, internal and phone bookings so you understand your flow better.
The team and services lack clear benchmarks
Before
Without rankings, you rely on intuition to coach the team or promote certain services.
With Bookelya
Detailed views rank the team and services by volume, revenue and occupancy.
Dashboard
Everything your Statistics area already shows you
Bookelya brings together the indicators that matter without complex setup or manual exports.
Comparison
Before / after at a glance
Subject
Without a structured tool
With Bookelya
Day-to-day management
Without a structured tool
Decisions made on instinct, with scattered numbers.
With Bookelya
Consolidated view with KPIs, business health and changes over time.
Analysis periods
Without a structured tool
Manual comparisons based on notes or memory.
With Bookelya
7-day, 30-day, month, quarter and custom date filters.
Booking channels
Without a structured tool
Impossible to clearly tell what comes from online booking, phone calls or internal entries.
With Bookelya
Visible breakdown by source so you understand how the schedule gets filled.
Team performance
Without a structured tool
Few benchmarks to compare team members beyond a general impression.
With Bookelya
Team ranking with appointments, revenue, average ticket and occupancy.
Services to grow
Without a structured tool
It is hard to know which services truly drive demand.
With Bookelya
Service ranking by active appointments and revenue.
3 steps
From reading the numbers to concrete decisions
Choose the period to analyze
Select the last 7 days, 30 days, the month, the quarter or your own dates.
Read the main signals
Start with revenue, average ticket, occupancy, cancellations and absences.
Go to the relevant level of detail
Then open sources, clients, team members and services to know what to adjust.
Specialisations covered
One dashboard for all beauty businesses
Hair salon
Track revenue by hairstylist, top services and the slots that fill best.
Beauty salon
Measure average ticket, loyalty and the distribution of your treatments over each period.
Barbershop
Identify your most profitable days, loyal clients and the channels that generate the most appointments.
Spa & wellness
Analyze occupancy on longer services and see where activity should be strengthened.
Nail salon
Compare the most booked services, volume per technician and the periods that support demand best.
Aesthetics center
Keep a clear view of technical services, client recurrence and team performance.
Reassurance
Launch the feature with confidence
Indicators based on your real data
Metrics are calculated from the appointments, statuses, planned working hours and sources already present in your account.

A reading designed for action
Gauges, breakdowns, charts and rankings give you a clear overview before the detail, without exporting a single spreadsheet.
Management insights that help every day
You know faster what to adjust: availability, reminders, booking channels or promoting certain services.

FAQ
Questions before managing your business through numbers
Ready to read your business differently?
Create my account for freeCreate your account and run your business with clear numbers
Activate your pro space and track your business without spreadsheets.
Create my account for free